By: Brian T. Burton, CFP®, CIMA®
You’ve probably heard about stock market breadth at this point, it has become quite the talking point amongst financial pundits. But what exactly is it? The term, market breadth, can simply be defined as how many stocks are participating in an index’s rise or fall, helping to assess the overall health of the market and providing valuable insights about the sustainability of future market performance. In 2023, market breadth was very weak. The 24% return on the S&P 500 was disproportionately driven by the top seven weightings (the Magnificent Seven), which accounted for almost 60% of the total return on the index. In addition, only 3 of the 11 S&P sectors outperformed the overall index for the year, leaving most diversified investment strategies to largely underperform.
At the tail end of last year and the early part of this year, we saw signs in the market rally of expanding participation, especially among the more cyclical sectors. Unfortunately, this theme was short-lived as the mega-cap technology stocks came roaring back while nearly everything else lost ground. Value stocks, along with small caps, have underperformed dramatically. This tends to be the case when monetary policy is the focus of market attention. This broad lack of breadth tells us the underlying business fundamentals of the other 493 companies may be overstated because of the strong performance of the index.
There may be hope on the horizon; however, as forecasts for interest rate cuts appear to be moving closer with the softer inflation data released last week. Markets were pricing in a December rate cut as the first, but now are calling for September as the jumping-off spot. As a result, small-cap stocks, represented by the Russell 2000 index, outperformed the tech-heavy Nasdaq by over 500 bps (5%) in a single trading day. This is a sign of optimism that the broadening trend we saw earlier in the year may regain steam when the Fed’s rate cuts actually start rolling out.
Another positive sign of the potential broadening of the market is future earnings forecasts. The chart below shows how the 2nd quarter of this year is expected to be the first quarter of EPS growth for the other 493 since Q422, while growth for the Magnificent 7 is expected to slow for the second consecutive quarter, and again in Q3. By Q4 of this year, the remaining 493 are forecast to see growth in line with the Mag 7.
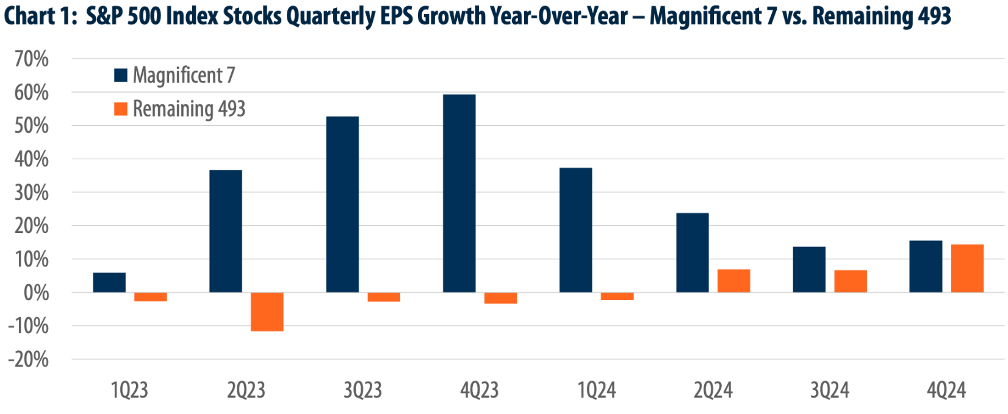
Source for Charts: S&P Capital IQ. Data as of 3/28/24.
Cost-cutting measures could also be a major tailwind for non-tech sectors moving forward. A significant source of the strong earnings growth seen in 2023 for the Mag 7 can be attributed to common share buybacks. Still, they were early adopters of layoffs and other cost-cutting measures due to an earnings recession in the industry, also helping drive earnings growth. So far in 2024, tech layoffs have significantly decreased while layoffs outside of the tech sector have increased. These efforts are expected to enhance margins for the other 493 in late 2024 and 2025. With strong earnings growth and cheaper valuations, the forgotten-about 493 may be set for a comeback.