With the S&P 500 and Nasdaq both entering “Correction Territory,” the media has once again focused its attention on markets and everyone’s best prediction on when or if a looming recession may be coming. For the majority scratching their heads right now, a “correction” is simply defined as an index decline of 10% or more from a peak. This year has been anything but boring, with a large disparity in equity performance, while Treasuries are all yielding near 5% and the 10-Year Treasury marking a 16-year high.
The chart below summarizes the disparity in returns both within the largest 500 companies and the smaller mid-cap and small-cap indices. The largest driver of returns within the US markets is resulting from a handful of large-cap growth names, commonly coined the “Magnificent 7.” In particular, performance returns may vary significantly depending on an investor’s ownership percentage (or potential overconcentration) to these seven stocks in particular.
| Index/ETF | YTD Performance | Representation |
| S&P 500 Top Ten | 46.22% | Ten largest companies from the S&P 500, market cap weighted. |
| S&P 500 | 10.38% | 500 of the largest, leading US equity companies, market cap weighted. |
| RSP | -2.18% | Diversified exposure to an equal weighting of all S&P 500 stocks. |
| S&P Mid Cap 400 | -2.03% | Index measures the performance of 400 mid-sized companies. |
| S&P Small Cap 600 | -5.93% | Index measures the small-cap segment of the U.S. equity market. |
*Source: https://www.spglobal.com/spdji/en/index-family/equity/us-equity/us-market-cap/#overview RSP data from Morningstar. Performance data as of 11/1/23
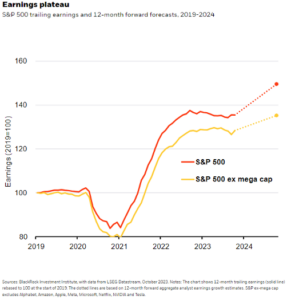
Many are asking why we are seeing such disparity. As we review the underlying earnings of the S&P 500, we have seen a flattening of results and a clear divergence of earnings between the largest companies versus the remaining. However, it is important to note that earnings are up relative to a pre-pandemic baseline. Considering slowing earnings, the macroeconomic environment is disjointed with data supporting two different narratives. The following is a recap of the most impactful narratives, but the list could go on and on.
Positives for the Economy:
- Inflation has come down significantly, with a relative “soft landing” so far. Currently, inflation is 3.7%, as compared to 8.22% a year ago. The Fed is still targeting a 2% figure.
- Gross Domestic Product (GDP – a measure of goods/services produced in the US) rose to 4.9% in Q3, ahead of the 4.7% estimate. This was a positive reading.
- Consumers continue to spend money, supporting economic growth. Consumer spending increased 4% in Q3 and was responsible for 2.7% of the GPD figure above.
- During September, Durable Goods Orders posted their biggest gain since July 2020.
- The unemployment rate remains strong at 3.8%, with a relatively full workforce. The Labor Force Participation rate is up and is approaching its pre-pandemic level.
- Monthly debt service as a percent of disposable personal income remains near a 10-year trend, lower than the 1980s – 2010, and has declined the past two readings. 2
Negatives:
- Many pundits and economists believe that Q3 may be the peak of economic activity within the current economic cycle.
- As consumers continue to spend, consumer sentiment falls for the third month in a row.1
- Higher interest rates are more widely affecting both consumers and businesses, as both normal economic activities and debt refinancing are now experiencing higher rates.
- As businesses combat supply-related inflation, wage inflation, higher borrowing rates, extended corporate cost-cutting, and pressure on previous pricing powers, economists question growing profit margin capabilities in the current environment.
- Fed Chair Jerome Powell reinforced a need for continued higher rates and suggested further hikes could be needed if sustained economic growth drives persistent inflation.
- Relatively higher interest rates are delaying some consumers/businesses from borrowing to take on new projects/opportunities due to emotional feelings toward rates.
- Continued and growing geopolitical risks.
Conclusion
Two diverging narratives can be formed: one supporting a continued resilient market/economy and one supporting a slowing economy or changing of the business cycle. Without question, confirmation bias is available from both perspectives. Pundits and economists are hired to prognosticate these outcomes, but they are very difficult, if not impossible, to predict accurately.
Rather than speculating and fretting over the unknown, let’s control the things we can control. Below is a list of planning activities to consider:
- Liquidity – Let’s plan for liquidity needs in the next three years.
- De-Risk – Now is a great time to consider debt reduction strategies.
- Re-Test – Let’s retest your plan and consider multiple different scenarios within the plan.
- Stay the course – Business cycles expand and contract. This is a normal phase of the economy, with a financial plan built around fundamental planning, staying the course is typically our best option.
As always, we are here to help advise and manage financial decisions through any and all economic environments. Please do not hesitate to reach out with any questions or planning needs. As we enter the last two months of the year, now is a great time to review your plan.