Key Takeaways:
- The 2-year/10-year yield curve inverted for the first time since 2019.
- This type of inversion has preceded the last eight recessions.
- Proper portfolio allocation can help insulate investors from the negative outcomes of recessions.
Three years ago today, on April 4, 2019, I wrote about the Inverted Yield Curve of March 2019. At that time, it was the 3-month/10-year curve that inverted. Later, in August 2019, the 2-year/10-year curve inverted – this is the kind of inversion that investors tend to view as most meaningful. Fast forward three years to this past Friday, April 1, 2022: the 2-year/10-year yield curve once again closed inverted.
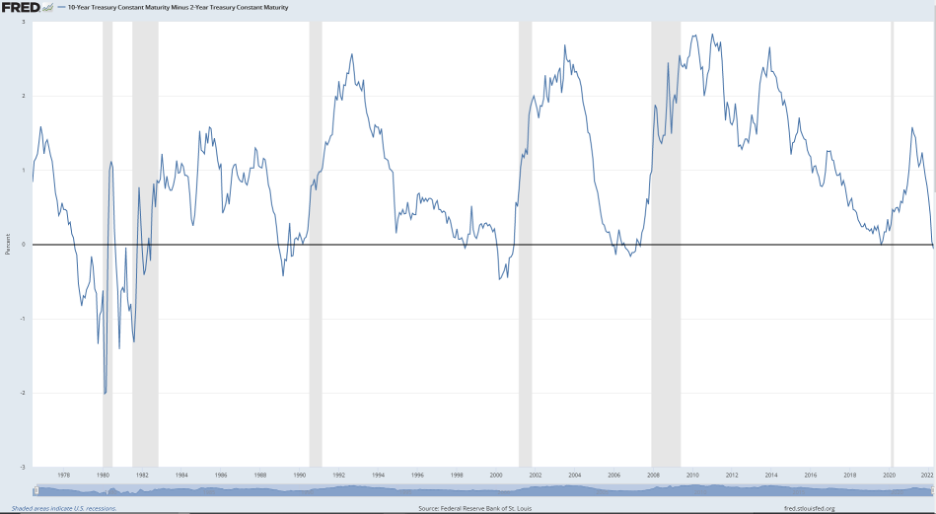
Why do market analysts pay so much attention to the 2-year/10-year curve? Because when it inverts, meaning the 2-year yield is higher than the 10-year yield, it has been an accurate signal in predicting the last eight recessions going back to 1969. In the chart below, any time the blue line goes below the black horizontal line, the 2-year/10-year curve has inverted. The grey vertical bars represent U.S. recessions. We can just see this latest inversion on the very far right side of the chart.
It is important to note that the yield curve inversion is seen as a signal of a future recession, not a triggering event. Economists are arguing that this inversion is a result of Fed action, essentially discounting its value as a recession predictor. Massive inflation forced the Fed to raise interest rates in March 2022 – the first increase since 2018. The Fed has also signaled that it will raise rates another six times in 2022.
When the Fed increases interest rates, it has a relatively direct impact on increasing shorter-term bond yields. Further, the Fed has purchased over $3 trillion of U.S. Treasuries since the beginning of the pandemic, which could have an impact on longer-term rates. Combine the two factors and you have a situation where yield curve inversions are not all that surprising.
You could even make the argument that using the yield curve inversion as a recession predictor is a bit like using a broken clock. When these inversions have happened in the past, the recessions that have followed have come anywhere from several months to two years after the initial inversion.
Anytime we are not currently in a recession, there is a recession in our future. Therefore, anytime there is a yield curve inversion, based on the cyclical nature of our economy, there is bound to be a recession on the way anyway. Take for example the 2-year/10-year inversion in August 2019, the short recession that followed in 2020 was caused by the global response to the pandemic – something the bond markets could not have ever predicted.
There are still other economists arguing that high inflation, oil prices, supply chain woes, and war in Ukraine are among the factors pointing to a recession in our future. This does not mean that you should ignore the signals that a recession may be incoming, nor does it mean you should go to all cash in your investment portfolio. Rather, this is a great reminder, especially in these environments, that it is of the utmost importance that your investment portfolio allocations match your needs – specifically your short- to medium-term liquidity needs.
By planning for your needs and anticipating the negative market cycles before they happen, you can avoid compounding negatives by being forced into a fire sale when the market is down. Our job is to help our clients identify their needs and then structure their portfolio allocation accordingly. In this way, we can help at least partially insulate them from the big “R” word that is always looming somewhere on the horizon.
Want to receive these commentaries directly in your inbox? Sign up for weekly newsletters, written by our advisors, here.
Sources:
Cheung, Brian; Recession warning sign flashes as yield curve inverts; Yahoo! finance; April 1, 2022; https://finance.yahoo.com/news/yield-curve-inverts-april-2022-200829124.html
Federal Reserve Bank of St. Louis; 10-Year Treasury Constant Maturity Minus 2-Year Treasury Constant Maturity; April 1, 2022; https://fred.stlouisfed.org/series/T10Y2Y